Usage & Performance Dashboard
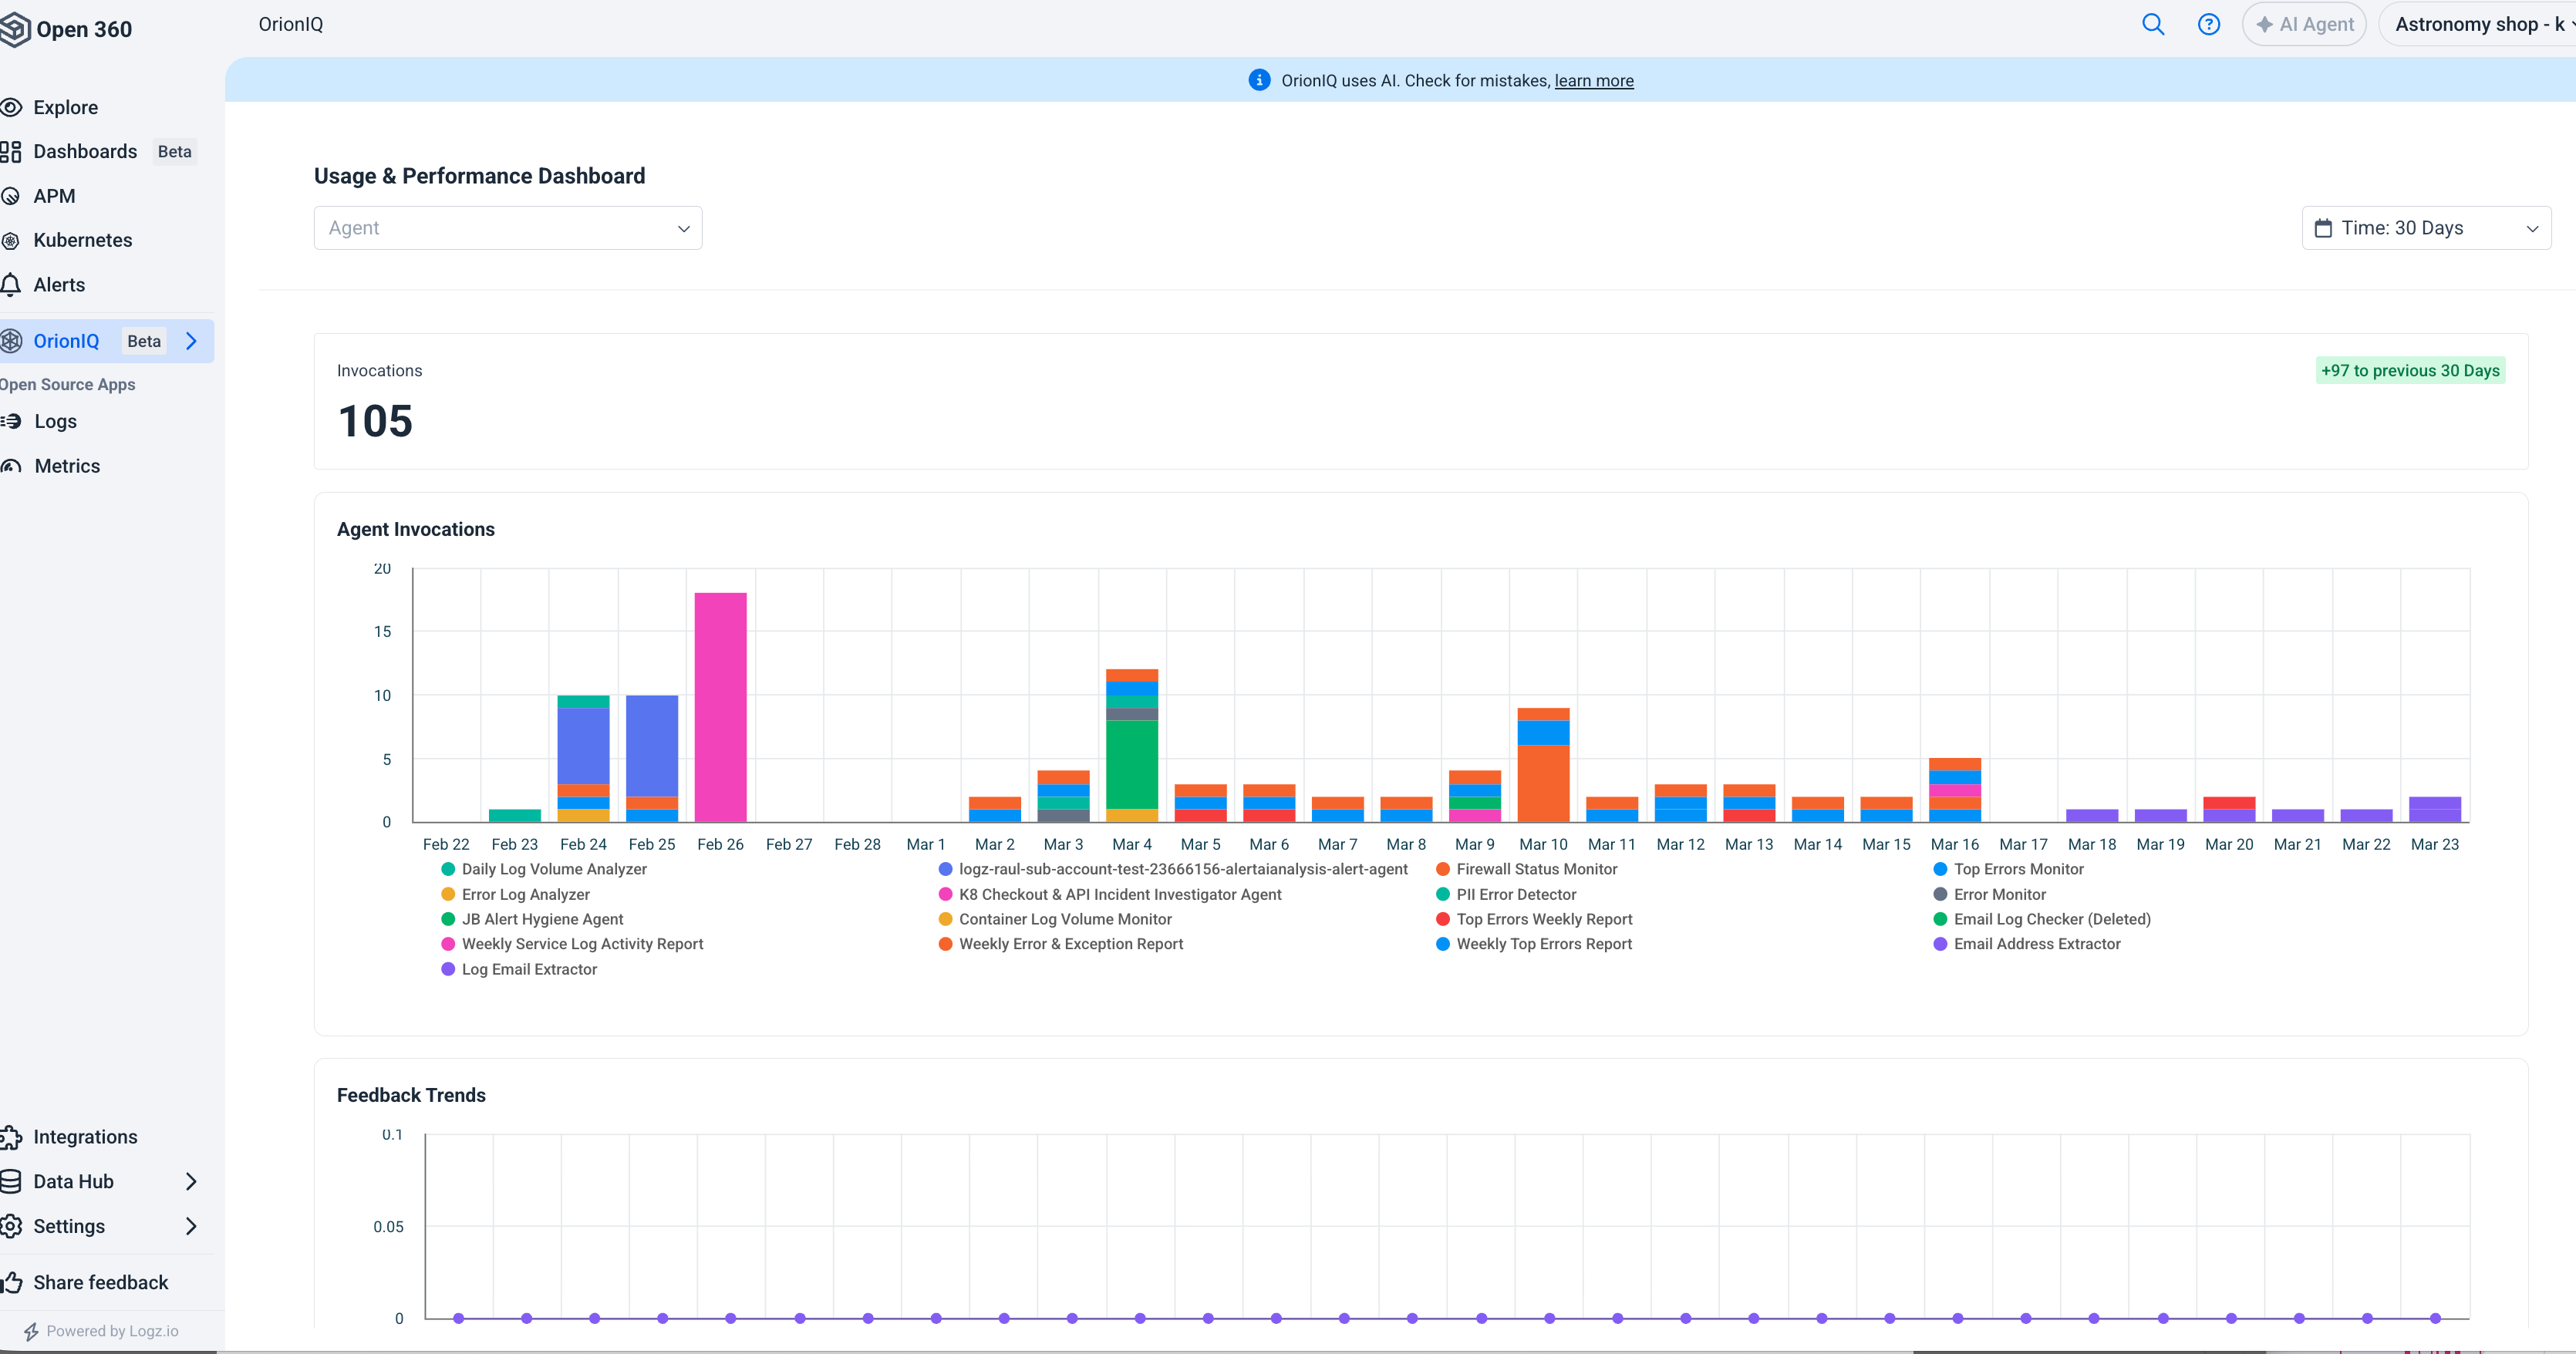
The Usage & Performance Dashboard gives you a high-level view of how your OrionIQ agents are performing. Use it to track invocation volume, monitor costs, and evaluate agent reliability over time.
To access the dashboard, navigate to OrionIQ > Usage & Performance Report in the left navigation menu.
Dashboard tabs
The dashboard has two tabs:
- AI Agents: Invocation volume, feedback, and cost for your agents.
- AI Chat: Token usage for OrionIQ chat.
OrionIQ chat is reported only under AI Chat — its invocations are excluded from the AI Agents tab so they don't skew per-agent figures.
Dashboard filters
Use the filters at the top of the page to narrow the data displayed:
- Agent: Select a specific agent or view data for all agents.
- Agent Type: Show only agents of a specific type.
- Time: Choose a time range (for example, 30 Days) to control the reporting period.
Invocations
The top of the dashboard shows the total number of invocations during the selected period, along with a comparison to the previous period (for example, "+240 to previous 30 Days").
Agent invocations chart
The Agent Invocations bar chart shows daily invocation volume broken down by agent. Each color represents a different agent, making it easy to spot which agents are running most frequently and identify usage trends over time.
Feedback trends
The Feedback Trends chart tracks feedback scores over time. This helps you evaluate whether agents are producing useful results and identify agents that may need their instructions refined.
Summary table
The summary table at the bottom of the dashboard provides a per-agent breakdown with the following columns:
| Column | Description |
|---|---|
| Name | The agent name. |
| Agent Type | The agent type. |
| Invocations | Total number of invocations during the selected period. |
| Avg. Feedback Score | The average feedback score received across all invocations. |
| Feedback Coverage | The percentage of invocations that received feedback. |
| Invocation Cost | The cost charged per invocation of the agent. |
| Total Cost ($) | The total cost of the agent's invocations during the selected period. |
Invocations whose agent no longer exists — for example, a deleted agent — are grouped under Unknown Agent, one row per agent type, so the totals stay complete.
Regularly review the Usage & Performance Dashboard to identify agents with low feedback coverage. Providing feedback on agent results helps improve AI performance and ensures your agents deliver reliable analysis.